25.07.2019

More Power for PPM: Use Case Dynamics PSA Status Reporting

Does your project team still use Excel spreadsheets to track project schedules and PowerPoint to provide status updates? Power it with Power platform tools such as Power BI and Flow! This blog post will provide an overview on how to create a status report with historized project data based on Power BI.

In the course of a project the project manager usually sooner or later has to provide some sort of status report. The goal of a status report is to provide all important project information such as important milestones, costs, risks and progress at a glance. Creating a status report from scratch or filling it manually each time consumes time that otherwise could be better used really managing the project. Facilitating status report creation is therefore a common requirement when project management systems are introduced or enhanced.

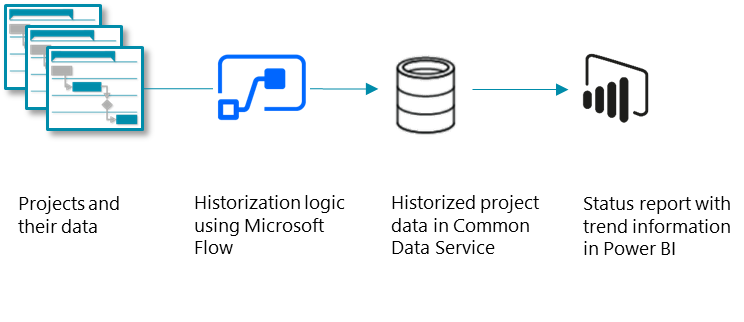
The current status can be realized with live data from a project management system but taking into account information from the past allows for better analytics, e.g. about the real progress since the last reporting period or a Milestone Trend Analysis. For this kind of analytics historized data is required and allows for a better tracking of changes on project schedule and status over time.

To realize a report based on historized data Common Data Service for Apps (CDS) can be used as history data storage. It can easily be extended in the first step with a historization data structure including entities and relationships. The project data could be integrated from different tools (e.g. Dynamics 365 Project Service Automation, Project Online or SharePoint). Via Flow a snapshot creation can be triggered to copy information in the above defined entities. Power BI as reporting layer could use CDS as data source to generate useful reports and dashboards to provide a better overview of single projects or the entire project portfolio. Additional applications and features can be built with PowerApps, e.g. a status report approval app. An extension or modification of each component is always possible.

For our showcase in this blog we’re going to use Dynamics 365 Project Service Automation (PSA) as source system for our project information. This project management tool is already built on the Power platform, the same infrastructure that the soon-to-come modern Project service by Microsoft will use as well. Therefore, the combination of Common Data Service for Apps (CDS), Flow and Power BI, which were introduced in our previous blogposts, allows us to easily develop this use case.


Common Data Service for Apps

With CDS you can simply define and create a data structure for your business concepts and activities with collections such as entities, fields and relationships.  For our use case we created an entity “ProjectHistory” with a many-to-one relation to our existing “Project” entity and several fields which represent the historized project data which will be filled by Flow. Since CDS is a user-friendly service the creation of the entity and the fields is an easy step.

Flow

As Flow is a no-code/low-code software you can easily create a workflow without any programming skills. In order to take a snapshot of a project in PSA you must create a Flow with steps which store the relevant project data into the previously created CDS entity “ProjectHistory”.

Once created and published you can trigger the flow for each project on the project site.

Power BI

During the last few years Power BI became quickly popular in the Data Analytics universe and therefore also for status reporting in project management.
Power BI can be simply connected with CDS to create status reports based on the stored data. The entity “ProjectHistory” is one of the relevant datasets you need to visualize the data and snapshots. With the Power BI visualization “Slicer” you can choose your needed snapshot and then easily compare the previous progress with the actual one as well as visualize other comparisons.
Besides the historized data you can also display actual risks and costs in a table, active risks in a pie chart, a risks matrix, upcoming tasks/actions and general status information. All information can be displayed in clear arranged boxes.

Once the status report definition is finished you can integrate and embed it directly on PSA.

Benefits

  • Low code solution that can be built by a Power User
  • No additional license costs, if already using PSA
  • Direct integration with PM tool on the same platform
  • Flexible in every aspect:
    • Data managed in a project (e.g. add the risk register which is not standard)
    • Data historized (project & task data as well as additional risk data)
    • Point in time when data is historized
    • Look & feel as well as content of reports